وثيقة
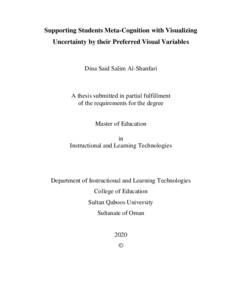
Supporting students meta-cognition with visualizing uncertainty by their preferred visual variables.
الناشر
Sultan Qaboos University.
ميلادي
2020
اللغة
الأنجليزية
الملخص الإنجليزي
Information visualization through visual images has been an effective way to
convey both abstract and tangible ideas. This study explored students' preferred
visualization method when using visual variables to show uncertainty in the data. In
this research, uncertainty represents the discrepancy between the student's perceived
and actual knowledge in an e-learning system. In specific, the study identified the most
preferred visual variable among the three visual variables: opacity, line thickness, and
added symbols. Viewing these discrepancies in the data can help students better
understand the data depicted by visual variables and enhance their metacognitive
skills. Properly chosen visual variables can spontaneously allow users to recognize the
patterns illustrated by those visual variables without the need to divide their attention
between two cognitive tasks. To answer the research question, the researcher followed
an exploratory approach. The population of the study is all students at SQU. The
sample size is 215 students enrolled in the university elective course titled the Fourth
Industrial Revolution. Out of the 215 students, only 83 students remained the main
sample because they completed both the Criterion References Test (CRT) and the
paired comparison and passed the 80% on the CRT. Thurstone paired comparison and
inferential statistics were used to analyze the data using R programming language.
Thurstone test ranks the variables on a preferences scale from the most to the least
preferred. The test ranked the three variables from most to least as follows: line
thickness, added symbols, and opacity. The inferential statistics showed that there are
no significant differences in preference among the three variables. However, based on
college classification, there were significant differences between students from science
colleges and humanities colleges regarding the variables line thickness and added
symbols. On the other hand, there was no significant difference between different
colleges when choosing opacity as their preferred method. The findings of the study
can help system designers create visuals with preferred visuals that aid the students to
visualize uncertainty when students interact within an e-learning system.
المجموعة
URL المصدر
الملخص العربي
يعد تصور المعلومات من خلال الوسائل المرئية وسيلة فعالة لنقل الافكار المجردة والملموسة، تهدف هذه الدراسة إلى استكشاف طريقة التصور المفضلة لدى الطلبة عن طريق استخدام المتغيرات المرئية إلظهار التناقض بين المعرفة المتصورة للطالب والمعرفة الفعلية في نظام التعلم الالكتروني، حيث من المأمل أن تحدد الدراسة المتغير المرئي الاكثر تفضيلا تعتيم، وسمك الخط ، والرموز المضافة. كما يمكن أن بين المتغيرات المرئية الثلاثة: لا يساعد عرض هذه التناقضات في بيانات الطلبة على فهم البيانات التي تصورها المتغيرات المرئية بشكل أفضل وتعزيز مهاراتهم الادراكية، كما يمكن للمتغيرات المرئية المنتقاة جيدًا أن تسمح تلقائيًا للمستخدمين بالتعرف على الانماط الموضحة بواسطة تلك المتغيرات المرئية دون الحاجة إلى تقسيم انتباههم بين مهمتين. اتبعت الباحثة المنهج الاستكشافي باستخدام المنهج النوعي لإلجابة على سؤال البحث، ش كل جميع طالب جامعة السلطان قابوس مجتمع الدراسة الحالية، حيث بلغ إطار العينة )215 )طالباً وطالبة مسجلين في المقرر الجامعي الاختياري بعنوان الثورة الصناعية الرابعة، بقي منهم )83 )طالبًا فقط هم العينة النهائية حيث أكملوا اختبار محكي المرجع )CRT ) والمقارنة المزدوجة واجتازوا نسبة )80 )٪في اختبار الـ )CRT ،)تم استخدام طريقة المقارنة مع اختبار ثيرستون والاحصائيات الوصفية والاستداللية لتحليل البيانات باستخدام لغة البرمجة )R ،)حيث يقوم اختبار ثيرستون بتصنيف المتغيرات على مقياس التفضيالت من الاكثر تفضيالً وجاءت نتائج تصنيف إلى الاقل تفضيالً، المتغيرات على النحو التالي: سمك الخط ، والرموز المضافة ، ثم العتامة. أظهرت الاحصائيات الاستنتاجية عدم وجود فروق ذات داللة إحصائية في التفضيل بين المتغيرات الثالثة، ولكن عند مقارنة العينة بنا ًء على تصنيف الكليات بالجامعة، كانت هناك فروق ذات داللة إحصائية بين الكليات العلمية وكليات العلوم الانسانية فيما يتعلق ٍو بالمتغيرين في جميع الكليات. يمكن سمك الخط والرموز المضافة، وفي المقابل كان التعتيم مفضًال بشكل متسا أن تساعد نتائج الدراسة الحالية مصممي النظم الالكترونية على تصور البيانات الغير متباينة أو المتناقضة عندما يتم أخذ الطريقة التي يفضلها الطالب بعين الاعتبار في أنظمة التعليم الالكتروني. كلمات البحث المفتاحية: تصور المعلومات، تصورعدم اليقين، ما وراء المعرفة.
قالب العنصر
الرسائل والأطروحات الجامعية

