Document
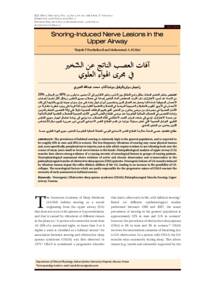
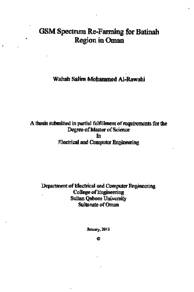
Statistical signal characterization and subband decomposition for heart rate variability analysis in patients with obstructive sleep apnea
Publisher
Sultan Qaboos University
Gregorian
2003
Language
English
English abstract
Abstract
Obstructive Sleep Apnea (OSA) is the cessation of breathing during sleep due to the collapse of upper airway. Apnea patients have increased risk of hypertension and heart failures. Polysomnographic recording is a conventional method for detection of OSA. Although it provides reliable results, it is expensive and cumbersome. Time domain and frequency domain analysis of heart rate variability (HRV) are new promising and non-invasive methods for detection of OSA. Many physiological activities are reflected as cyclic variations in RR interval (RRI) measures of HRV. Many studies have shown that OSA patients tend to have spectral peaks between 0.01 and 0.05 Hz of RRI spectrum. ECG records for 55 severe OSA patients and 35 normal subjects are acquired from Physionet website and from Department of Physiology in Sultan Qaboos University (SQU) Hospital. RRI data are extracted from these ECG records using QRS detection software provided by Physionet itself. The generated RRI data are then smoothed and filtered to remove false intervals and to substitute for missed intervals, as well as to screen the oscillations of OSA. Three types of RRI data groups are generated: non filtered RRI (RRI-NF), band pass filtered (RRI-F1) and high pass filtered (RRI-F2). Each RRI data group is analyzed independently. In this thesis, two new analysis methods are used to screen OSA and normal subjects. These methods are: Hilbert Transform followed by Statistical Signal Characterization (HTSSC) method and Sub-band decomposition (SB) method. HTSSC is a time domain analysis that manipulates RRI data in minute-by-minute basis and extracts 8 statistical parameters for each minute. The ability of these parameters to screen OSA is assessed by Receiver Operating Characteristics (ROC). Three of those parameters: mean of amplitude (MA), deviation of amplitude (DA) and maximum amplitude (MAXA), are found to produce the best range of accuracy (93-96%), specificity (93-100%), and sensitivity (87-100%) results. SB is a frequency domain analysis that is used to estimate the power spectral density (PSD) of RRI data without performing actual transformation to frequency domain, and to define the three bands of RRI spectrum: very low frequency (VLF), low frequency (LF) and high frequency (HF). The power ratios LF/HF and LF/VLF are then calculated for each RRI data group. The performance is also evaluate produced the best results when used with non-filtered RRI data. The maximum accuracy, specificity and sensitivity obtained by SB are: 93%, 94% and 98% respectively.
Member of
Resource URL
Arabic abstract
ملخص البحث
طريقتي الوصف الإحصائي للإشارة (SSC) وتوزيع الجزم الترددية (SB) لتحليل التغيرات في معدل نبضات القلب لغربلة مرضى إنسداد التنفس اثناء النوم "الأبنيا" هو انقطاع التنفس اثناء النوم بسبب ارتخاء العضلات في مجرى التنفس العلوي مسببة انسداد المجرى ومنع تدفق الهواء. ان وجود هذا الاضطراب في التنفس يزيد من احتمالات التعرض الارتفاع ضغط الدم وحدوث الامراض القلبية التي قد تؤدي الى الوفاة. يتطلب تشخيص هذا المرض حاليا ضرورة قضاء ليلة كاملة في المستشفى يتم خلالها تسجيل مختلف الاشارات الفزيولوجية الجسم المريض اثناء فترة النوم. بعدها يقوم الأخصائي بتحليل هذه البيانات لاكتشاف المرض أو أي اعتلال اخر. الا ان هذه العملية بالرغم من فعاليتها تعد مكلفة ومرهقة سواء بالنسبة للمريض أو الأخصائي الذي قد يستغرق ساعات طويلة للتحليل. تجري الدراسات الحالية على ايجاد خيارات أخرى لاكتشاف المرض تقوم على اساس تحلیل التغيرات في معدل نبضات القلب (HR او الفترات الزمنية لنبضات القلب (RRI) اما تحليلازمنيا او تجليلا طيفيا. اثبتت الدراسات على أن التغيرات في الفترات الزمنية لنبضات القلب المصاحبة للابنيا في الحالات المرضية يمكن ملاحظتها في مجال التردد من 0, 01 إلى ۰٫05 هرتز والتي
تختفي في الأشخاص الأصحاء. في هذه الدراسة نقوم بتحليل اشارات الفترات الزمنية لنبضات القلب لخمسة وخمسون مريضا وخمسة وثلاثون شخصا سليما. استخرجت هذه البيانات من شبكة المعلومات العالمية ومن قسم الفزيولوجيا في مستشفى جامعة السلطان قابوس. تمر هذه الإشارات بعدة مراحل ومعالجات اولية لتصفية وتنقية البيانات من التشويش والأخطاء، ومن ثم لعملية ترشيح لحصر التغيرات المصاحبة للابنيا، و تثبيط التغيرات الأخرى نستخدم في هذه الدراسة طريقتين جديدتين لتحليل الفترات الزمنية (RRI). الطريقة الأولى تقوم بتحليل كل دقيقة من هذه البيانات في المجال الزمني واستخراج ثمانية عوامل (متغيرات) احصائية. تقيم كفاءة كل عامل من هذه العوامل على حسب كفاءة تصنيف الحالات المرضية وكفاءة تصنيف الحالات السليمة، والكفاءة الإجمالية للتصنيف. من بين العوامل الثمانية، ثلاثة منها فقط اعطت اعلى مستوى في الكفاءة كما يلي: كفاءة تصنيف الحالات المرضية:۸۷-۱۰۰%، وكفاءة تصنيف الحالات السليمة: ۹۳-۱۰۰%، والكفاءة الإجمالية: ۹۳-۹۹%. . أما الطريقة الثانية فانها تقوم بتقدير طيف الفترات النبضية القلب، ومن ثم حساب الطاقة في ثلاث حزم طيفية مختلفة محصورة بالترددات التالية: الحزمة الأولى اقل من 0, 04 هرتز، الحزمة
الثانية من 0, 04 إلى 15,. هرتز، والحزمة الثالثة من 15 إلى 0, 4 هرتز. بعدها نقوم بايجاد نسب الطاقة بين الحزمة الأولى والثانية، وما بين الحزمة الأولى والثالثة. تشكل قيم هاتين النسبتين معايير التصنيف بين الحالات المرضية والحالات السليمة. وكما هو الحال في الطريقة الأولى، نقوم بتقييم كفاءة كل نسبة وقدرتها على التصنيف. أعطت هذه الطريقة النتائج التالية: اعلى كفاءة التصنيف الحالات المرضية: ۹۸%، واعلى كفاءة التصنيف الحالات السليمة: 94%، والكفاءة الإجمالية: ۹۳%.
Category
Theses and Dissertations
File size
2.25 MB
0
0